GL
GL
 SA
SA EG
EG UAE
UAE ZA
ZA

Each and every day you want your warehouse operations to run smoothly and keep them that way for the entire shift, but ever wondered what’s the secret to this, then this post is for you. We’re unpacking how to use simple daily warehouse health checks to ensure your warehouse runs like a well oiled machine.
Your warehouse is a critical to your customer’s experience - so using daily, even hourly warehouse health checks via key warehouse KPIs will help you to highlight where your problem areas are before they occur.
Giving your customers exactly what they want, on time, every time, is the key to excellent customer service - and it all starts with your warehouse processes.
How health check KPIs help you run a successful warehouse
Your warehouse management system (WMS) is constantly capturing data. However, unless you know which data to look at (and how to transform the data into actionable insights), you’re just have data.
.gif?width=480&name=giphy%20(18).gif)
Understanding why proactive health checks are critical to your warehouse operations is the first step towards a trouble free warehouse.
The second step is understanding which health checks to report on. Measuring the right metrics in your warehouse will help you benchmark your operation against top performers in your industry and begin to form a baseline for comparison.
The analytics your WMS derives from your day to day operations helps you identify any peaks and valleys in your performance and most importantly proactively action potential problem areas before they happen.
Warehouse health checks should happen daily so that you’re responsive
Knowing where you’re exceeding expectations and where you’re falling short allows you to address these weak points before they start costing you money and customers. A weekly or monthly report is essential for long term planning and review, but you need daily health checks to ensure small foundational issues don’t snowball into a much bigger problem than it would have been had you been alerted to them before or during the shift.
Which warehouse health checks you should use?
The following key warehouse metrics and health checks should be available on demand so that you can proactively address problem areas before they spiral out of control.
Once your teams have agreed on which are right for you, having a dashboard that automatically refreshes will help you identify any issues early on, and make it easy to identify and fix them proactively.
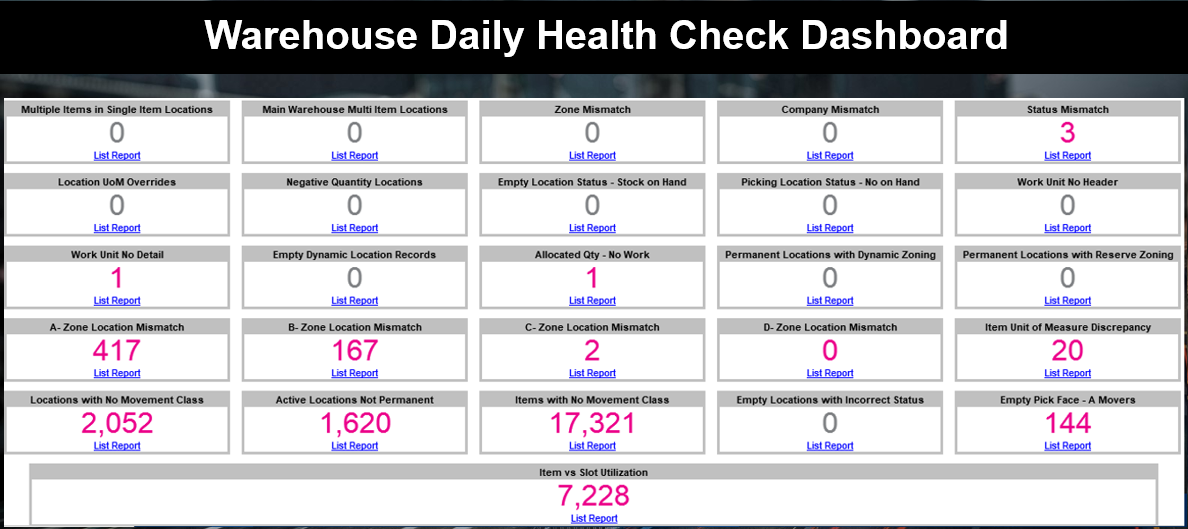
The below is an example of a health check dashboard which includes many of the key metrics we believe are essential for a healthy warehouse:
The following table explains some of the key metrics and the impact of getting these right or wrong.
|
Metric |
Description |
Impact |
|
Pick faces that are not permanent |
All pick face locations, which are active, but not configured, as permanent locations. |
Depending on the nature of your operation, the number and size of permanent pick faces is critical as they reduce excessive replenishment activity and ensuring rapid inventory availability. |
|
Duplicated item cross references |
Every barcode should be uniquely assigned to a single item. This master data metric displays any duplicated barcodes by cross referencing items. |
Duplicated barcodes can lead to inaccurate picking and frustrated clients who have to return goods. |
|
Incorrect unit of measure set up |
Shows any item where each unit of measure (UoM) has not interfaced as per the item master format. |
If this is incorrect, you will have multiple issues with putaway and picking. |
|
Inactive items with on hand quantity |
Provides a number of inactive items that still have a quantity on hand. |
If you not longer sell or stock the item - why do you want to store it in your warehouse? |
|
Pick faces without capacities |
This highlights all permanent pick faces that rely on item and location type dimensions to calculate the maximum quantity that fits into the permanent location, instead of a predefined maximum. |
If this is not set correctly, it’s unlikely that you’ll be utilising your pick face space optimally. |
|
Item location capacity |
Shows your total location capacities for all permanent pick faces for a given item, against the location status of the permanent pick faces. |
This ensures you have sufficient pick faces to meet demand. |
|
Item location capacity vs. location inventory |
Highlights all locations where there is an item location capacity record for a given item in a given location, but the item in the location differs from the item location capacity record. |
Helps you to right size and ensure your item and location(s) are best placed. |
|
Item location capacity with no maximums |
Provides a list of all item location capacity records that do not have a maximum quantity defined |
Prevents overfilling locations as the maximum quantity is defined. |
|
Items on sales orders |
Shows the total quantity ordered per item for a given date range. This is used as an ancillary report to determine whether items' permanent locations are sufficient in size. |
Helps you to plan if you have sufficient locations per item to meet demand. |
|
Items with incorrect allocation or locating rules |
Shows which items don’t match a specific allocation or locating rule template. |
Getting this wrong means your WMS rules wont work as desired. |
|
Items with no item cross references |
Monitor any items that don’t have at least one barcode configured, as the item code in the ERP system doesn’t match the barcode(s) on the different UoMs on the items. |
Issues with this means that different barcodes from various vendors won’t be recognised. |
|
Items with no pick locations |
Shows all items, with total quantity on hand, that don’t have at least one permanent pick face assigned. |
Depending on your operation, having at least one pick location will ensure speed of order fulfillment. |
|
Items without movement classes |
Provides a list of items that don’t have a movement class assigned. Items are either too new to have acquired a movement class, or don’t have a permanent location assigned. |
Categorising your items systematically will facilitate better warehouse slotting. |
|
Location inventory zero on hand quantity |
Provides a list of pick faces that have no on hand quantity |
Either your replenishment rules need rectifying or you don’t have the inventory - which may result in an inability to supply to customers. |
|
Location inventory by status |
Shows the location inventory record for each item in each location. |
Helps you to understand available inventory to sell and inventory that needs attention. |
|
Locations without movement classes |
Provides a list of locations that do not have a movement class assigned based on hit rate. |
Used to optimise product placement with warehouse layout. |
|
Locations without verification method |
Shows all locations that do not have a verification method set. In other words, all locations that don’t require validation by either check digit or location name. |
Depending on your business rules, verification methods will help improve accuracy. |
|
On hand quantity greater than location maximum |
View all locations where the item in the location is in a greater quantity than specified as the maximum in the item location capacity record. Basically, this shows the number of locations that are overfilled. |
You should be checking your unit of measure conversions and your location capacities. This is important because the size of each item is used to determine how many items go into each location. Having the incorrect dimensions will result in too many or too few items being stored in a location. |
|
Permanent location UoM validation |
Reports on the UoMs that are allowed in the permanent pick face locations for the item location assigned items. |
Often you don’t want each UoM to be in a pick face as it causes picker confusion. |
|
Stock take lean replenishment recommendation |
This isn’t a metric, however this report sets the minimum replenishment to a value higher than that of the current quantity on hand and in transit, so that all pick face locations are replenished before stocktake. |
Helps you to fill your pick faces prior to a stock take to facilitate easier counting. |
|
UoM discrepancy report |
Displays all items that contain a discrepancy in the item's UoM, such as no weight, or volume, or where the conversion quantity is set incorrectly. |
Critical to ensuring you are best using your master data to drive warehouse optimisation. |
|
UoM report |
Displays the UoM data by item (weight, volume, conversion quantity) for each unit of measure of an item. |
Used to validate whilst in-front of items |
|
Replenishment threshold recommendation |
This report uses a demand period to make recommendations on whether the current permanent pick face locations for an item is right sized, and whether this leads to replenishments too frequently. |
Getting this right will reduce your replenishment frequency. |
Read our article, What to measure in your warehouse, to find out more about which metrics matter in your overall warehouse success. The article includes a list of benchmarks so that you can check your performance against best in class industry standards.
Want to see what a world class supply chain looks like in action? Download the Tarsus Distribution case study to see how Tarsus (in partnership with Supply Chain Junction) used the Manhattan WMS to increase their warehouse efficiency by 60%.


Share